The short version. Two used cars of the same age, bought on the same day for similar money, can differ by a factor of 2.4 in how often they fail an MOT. On 2024 DVSA data the best mainstream family scores 63.5 on the MOT Risk Index and the worst scores 155.2, where 100 is normal for a car of that age.
Nothing on the forecourt tells you which one you are looking at when viewing a used car.
The number buyers look at is the wrong number

Ask what a used car is likely to cost you in repairs and most people reach for an MOT pass rate. It is public, it is free and it feels objective. It is also close to useless on its own, because a pass rate mostly measures how old a model’s surviving fleet is rather than how well that model was built.
A worked example makes the problem obvious. The Mazda MX-5 fails 24.84% of its initial MOTs, which sounds alarming, and the Volkswagen T-Roc fails 8.11%, which sounds excellent. Both impressions are wrong in the same way. The MX-5 population still being tested includes cars from the 1990s, while almost every T-Roc on the road is under seven years old. Judged against what cars of their own age actually do, the two are close, and both are good.
Correcting for that is the whole job of the MOT Risk Index. It compares each family with the national fleet of the same age and puts the answer on a scale where 100 is ordinary, below 100 is better than its years predict, and above 100 is worse.
The mainstream cars that age best
Luxury cars dominate any unfiltered reliability table, for reasons that have more to do with how they are stored and serviced than with engineering. The list below is restricted to ordinary volume brands, passenger cars only, and to families with at least 30,000 tests behind them, which is the list an actual used-car buyer needs.
| The ten mainstream used cars that beat their age expectation by the widest margin, ranked by the MOT Risk Index (100 = normal for the car’s age; lower is better). Source: MOT Risk Index, DVSA initial tests, calendar 2024. | ||||
| # | Car | MOT Risk Index | Raw failure rate | Tests |
| 1 | Toyota Estima | 63.5 | 19.25% | 37,275 |
| 2 | Volkswagen T-Roc | 64.3 | 8.11% | 127,769 |
| 3 | Honda HR-V | 67.6 | 12.20% | 52,626 |
| 4 | Ford Puma | 70.7 | 8.49% | 96,368 |
| 5 | Mazda MX-5 | 75.5 | 24.84% | 158,680 |
| 6 | Seat Ateca | 75.9 | 10.80% | 74,519 |
| 7 | Suzuki Celerio | 76.6 | 15.26% | 35,959 |
| 8 | Volkswagen Touareg | 76.8 | 19.81% | 72,654 |
| 9 | Skoda Karoq | 77.7 | 9.95% | 84,789 |
| 10 | Toyota Land Cruiser | 78.8 | 26.93% | 38,661 |
A car scoring 70 is not immune to expensive faults. It is failing roughly 30% less often than the national fleet of its own age, which over a three-year ownership is the difference between one awkward spring and three.
The other end, and an uncomfortable name at the top of it
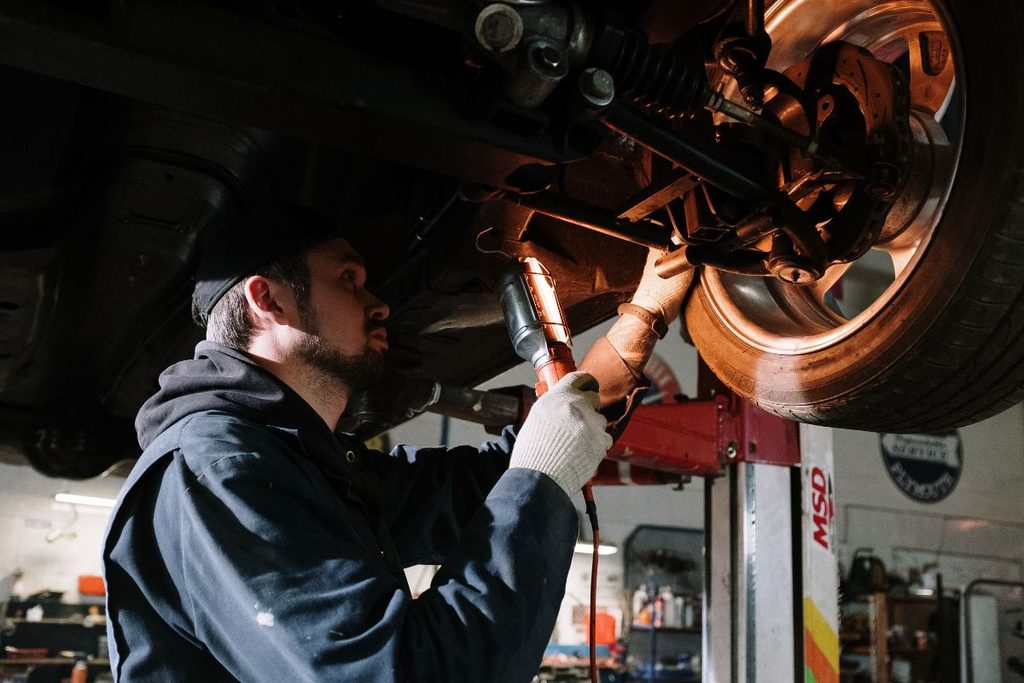
The worst mainstream performer on the same measure is the Dacia Sandero, at 155.2. Sold for years on being the cheapest new car you could buy in Britain, it fails 29.92% of its initial tests across 145,055 of them, and against cars of its own age that is roughly half as many failures again as normal. Its most common single failure is a split constant velocity joint boot, which is a cheap part attached to an expensive consequence if it is left alone.
The Sandero does not sit there by itself. The Dacia Duster scores 149.6, the Renault Clio 141.5 across 473,424 tests, the Renault Grand Scenic 141.6, the Citroen C4 139.9 and the Peugeot 2008 136.0. Eight of the ten worst mainstream cars carry French marques: Renault and Dacia account for five of them, Peugeot and Citroen for three. That is a pattern worth knowing before you shortlist on price alone.
The published ranking of the families that age best, with the margin of error on each, is at the MOT Risk Index list of the most reliable cars.
What this actually changes when you are standing next to the car
Three things follow from the data, and none of them requires you to become an expert.
First, read the MOT history before you read the advert. It is free on the government website, it covers every test since 2005, and it shows the mileage recorded each year. A car with a high index and a clean recent history is a better prospect than a car with a low index and three advisories nobody acted on.
Second, treat advisories as a schedule rather than as noise. Across 374 families in the underlying data, an advisory on tyres turns into an outright failure at the next test in roughly one case in eleven, and the median gap is twelve months. An advisory is the test telling you what will fail next, and roughly when.
Third, price the difference. If you are choosing between two cars of the same age and money, and one sits near 70 on the index while the other sits near 150, the cheaper purchase is not automatically the cheaper car. The national picture, including failure rates by age and by fuel type, is published at MOT failure rate statistics for Great Britain.
One honest limit. All of this describes populations, not individual cars. A carefully kept example of a poor performer will outlast a neglected example of a good one, and no index can see the service history of the specific car you are about to buy. What it can do is tell you where to look harder, which is more than a forecourt sticker will ever do.
Images courtesy of unsplash.com and pexels.com